Setting up Charts and Options
In the middle of the screen, you will be able to add 2 charts from the symbols in your Quote List. These charts are configurable and can be expanded to see studies in a larger data area.
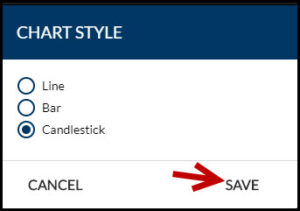
- Click on the Wheel icon next to your chart
- Click on Style

- Click on the style you desire
- Click on Save
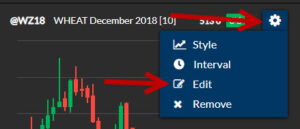
- Click on the Wheel icon next to your chart
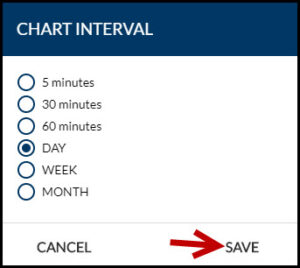
- Click on Interval
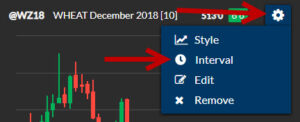
- Click on the desired interval
- Click on Save
- Click on the Wheel icon next to your chart
- Click on Edit
- Click on the contract that you would like to see in your chart.
- This list is pulled directly from your Quote List
- Click on Save

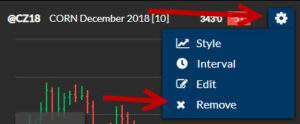
- Click on the Wheel icon next to your chart
- Click on Remove
- After you remove a Chart, there will be a blank space on your workspace
![]()
- To add a Chart back, click on Add Chart
- From Dialogue box, select the contract you want added
- This list is pulled directly from your Quote List
- Click on Save

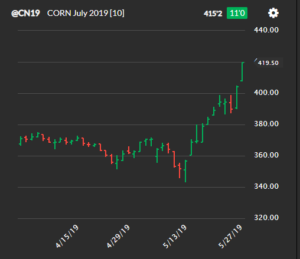
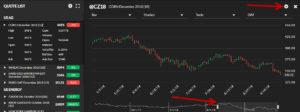
Any symbol from your Quote List can be opened in an expanded Chart view by clicking a symbol from your Quote List.
There are several settings that can be changed by using the drop down menus
- Bar – Change the display from Bar, to Candlestick to Line Chart
- Studies – the following studies can be added to the chart
- Bollinger Bands
- MACD
- Simple Moving Average (14 day)
- RSI
- Stochasic Osc
- Volume
- Tools – Add a trendline to your chart
- DAY– Change the time interval on your Chart
- Slider at bottom of chart – Click on the slider at the bottom of the chart and move to the time period you want to view. Click on the white bars to expand or contract the number of days you are looking at
- Click on the Wheel on the top of the chart window for the following options
- Compare Symbols – add up to 4 additional symbols to the existing chart by clicking on the desired contract.
- The list is pulled directly from your Quote List
- Adding additional symbols will disable any studies or trend lines currently on the chart
- CSV Export – This will open and Excel spreadsheet with the underlying data from the chart in a tabular form.
- If multiple symbols are on the chart, only the primary symbol’s data will be pulled into Excel
- Compare Symbols – add up to 4 additional symbols to the existing chart by clicking on the desired contract.
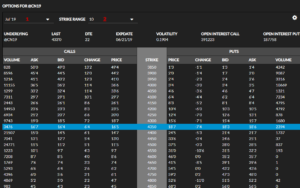
- To get to the Options Display, simply click on any symbol in your Quote List.
- This will bring up the expanded Charts.
- Scroll down to find the Options.
- You will be able to change some of the parameters on the dispaly
- (1) This drop down will allow you to change the underlying monthly futures contract
- (2) This drop down will allow you to change the Strike Range from 10 to 20.
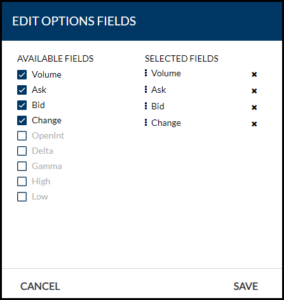
Field Settings
- To change the fields that are displayed, click on the wheel icon located at the right side of the screen.

- The Strike and Price fields will remain constant
- You can select up to 4 Fields to display
- First, remove the field to replace by clicking on the ‘X‘ next to it.
- Next, click on the box next to the field you want to add.
- Fields can be moved by clicking on a field and dragging it to the desired position.
- Click Save to keep you changes.